Barb TVPR Test Tool


TV PLAYER REPORT TEST TOOL
Document Description
This document accompanies the release of the Kantar Spring library implementation test tool. It covers:
- The heartbeats sent from the Spring libraries
- How to verify the accuracy of your implementation
- The Kantar Spring Testing Tool that provides logstream access for implementation validation
Heartbeats sent from the libraries
This section briefly explains what the heartbeats sent from the libraries should look like. A concrete example of a viewing session is used.
The content stream is started and the first request is transmitted:
Please use the record layout descriptions below for reference.
- counting domain: example.2cnt.net. Here, the “Sitename” is “example”.
- pl = player
- plv = player version
- sx = width of the stream window
- sy = height of the stream window
- stream = stream name
- cq = contentId
- uid = unique Id of the use process
- pst = play state (list of viewing intervals on the stream)
- dur = stream length in seconds (set up by the client)
- vt = view time in seconds (visual contact with the stream)
- First play state: 0+0+mbeswh :
The actual record output should look similar to below:
http://example.2cnt.net/j0=,,,pl=jwplayer+plv=version1+sx=640+sy=517;+,stream=od+cq=123456789+uid=3f3tv5p+pst=,,0+0+mbeswh;+,1+1+mbeswj;;+dur=1501+vt=2;;;
After viewing 2 min of the stream:
The output records should look similar to the records below, note the time of the “heartbeat” records (21, 41, 61 seconds etcetera)
http://example.2cnt.net/j0=,,,pl=jwplayer+plv=version1+sx=640+sy=517;+,stream=od+cq=123456789+uid=3f3tv5p+pst=,,0+0+mbeswh;+,1+21+mbeswj;;+dur=1501+vt=22;;;
http://example.2cnt.net/j0=,,,pl=jwplayer+plv=version1+sx=640+sy=517;+,stream=od+cq=123456789+uid=3f3tv5p+pst=,,0+0+mbeswh;+,1+41+mbeswj;;+dur=1501+vt=42;;;
http://example.2cnt.net/j0=,,,pl=jwplayer+plv=version1+sx=640+sy=517;+,stream=od+cq=123456789+uid=3f3tv5p+pst=,,0+0+mbeswh;+,1+61+mbeswj;;+dur=1501+vt=62;;;
http://example.2cnt.net/j0=,,,pl=jwplayer+plv=version1+sx=640+sy=517;+,stream=od+cq=123456789+uid=3f3tv5p+pst=,,0+0+mbeswh;+,1+83+mbeswj;;+dur=1501+vt=84;;;
http://example.2cnt.net/j0=,,,pl=jwplayer+plv=version1+sx=640+sy=517;+,stream=od+cq=123456789+uid=3f3tv5p+pst=,,0+0+mbeswh;+,1+105+mbeswj;;+dur=1501+vt=106;;;
Stopping the stream after 2:00 min:
Last play state: 1+120+mbeswj = 120 sec playtime.
http://example.2cnt.net/j0=,,,pl=jwplayer+plv=version1+sx=640+sy=517;+,stream=od+uid=3f3tv5p+pst=,,0+0+mbeswh;+,1+120+mbeswj;;+dur=1501+vt=124;;;
Note that the "uid" (uid=3f3tv5p) and stream name "stream=od" remained the same during the whole view sequence. This should always be the case when the implementation is correct.
If the "uid" or stream name changes, there is something wrong with the implementation and more than one view is being counted for this single view sequence.
The above example is a generic one.
You should be seeing heartbeats sent out at regular internvals 0,3,10,20,30,40,50,60,120,180,.. seconds (or every 20 seconds, depending on your market's setting).
NOTE: There may be 1 or 2 seconds added to every heartbeat due to internal workings of the library.
Verifying the accuracy of your implementation
Introduction
There are three steps involved in verifying your implementation.
- Observe the streams and verifying the content of heartbeats (recommended)
- Kantar scenario testing, using a staging release of your player (recommended)
- Kantar Spring confirm streams received and content of streams is as expected (mandatory)
Step 1
The log stream test tool provides a real-time quality assessment of your integration.
Where implementation does not meet project measurement requirements, the tool will give appro-priate warnings to highlight the variable(s) that need to be redefined.
Once no warnings or errors are returned, the implementation is verified as correct, i.e. correctly mapped variables are being sent as part of every request sent to the Kantar Media Spring meas-urement systems; user views from your app are being correctly received and processed.
Step 2
Once the log stream test tool verification is complete, your implementation can move to the next QA stage.
This recommended second stage involves a staging release of your player be made available to Kantar Media so we may run scenario streams.
We recommend using test flight (https://testflightapp.com/) for this purpose and can provide the de-vice UDIDs or equivalent. Other methods or products for providing access to a pre-release version of your implementation are of course, also accepted.
Scenario testing replicates a number of standard user actions so we may confirm how your player behaves in each case, and importantly, how our library acts accordingly, i.e. that it is correctly cap-turing all possible user interactions.
You can find an example list of the scenarios we test here.
Step 3
This last stage involves a Kantar Media Spring sense check to confirm the content of the streams is as expected.
While variables may be correctly mapped as part of your implementation, we undertake a human eye review in order to verify the data collected.
This is important because each broadcaster’s player app may work in subtly different ways, and in many cases, is subject to customization.
Moreover it is essential we confirm that stream interruptions are being correctly reported.
Examples of this include:
- No pre- or mid- or post-rolls are being measured as part of the programme stream
- No false ending implementations are affecting the measurement. For example when the duration of a stream is reported as higher than it actually is, or when the measurement is stopped before the player reaches the full duration of the stream.
Typically, this step is scheduled and completed for a single working day.
Final sign-off
Once all 3 steps are complete, Kantar Media will sign-off your implementation, confirming that all aspects are as expected.
Your implementation may then be scheduled for live publication.
Mobile Test Tool
The mobile test tool is not available anymore.
Kantar Spring Testing Tool
Introduction
The tool provides test teams with access to Kantar Spring servers for the purpose of validating Kan-tar Spring library implementations for mobile platforms. It connects to the logstream on the measurement servers in real-time, filtering data traffic based on the values entered in the form to display your unique test.
The tool will:
- Parse the logstream
- Validate JSON objects (the URI-strings sent to our systems)
- Throw exceptions in case of errors (e.g. JSON structure, in the order in which requests are sent)
Each app should be tested with at least two devices; this is to ensure that different devices are uniquely identified. You may use an emulator as one of these devices – the tool will work for either emulator or real mobile device tests.
Procedure Overview
Getting started
You will need the device ID of your test device and optionally the name of your app (<application>).
- For iOS, please use:
- Any iOS version higher than 6: the Apple Advertising ID
- If your app does not use the Apple Advertising Framework, then you need to use the ID for Vendor
- For Android, please use the Android-ID (AID) or Device-ID (DID) or Google Advertising ID (GID).
You can read your device ID (MAC address, Advertising ID, AID, DID) with the help of free apps that can be downloaded from the respective app stores.
- iOS: App “my device info” at Apple App Store
- Android: App “ID” at Google Play,
- Windows Phone: Tool “device ID” at Windows Phone Marketplace
Your browser settings:
- Please use an html5-capable browser
- Please enable Java Script
- We recommend the use of a modern and up-to-date browser such as Firefox, Chrome, ...
Please ensure that WebSockets is not being blocked by a firewall.
http://en.wikipedia.org/wiki/WebSocket
Beginning the test
Log on to the web interface and enter on the Initial Screen (see illustration below)
- Field 1 - your application name (<application>) – OPTIONAL
- Field 2 - your device ID (IDFA, IFV) – MANDATORY
- Field 3 - your Site Code (a.k.a. Sitename) – MANDATORY
Then Select the operating system of your app: Android, iOS …
Click the button "Start test!"
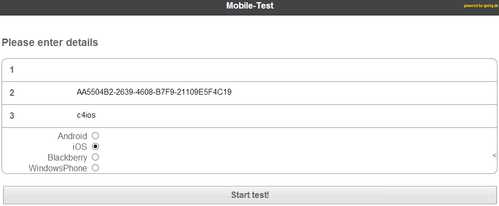
Illustration 1: Initial main screen
Now start the app to be tested on the test device or emulator identified in Field 2 above.
Begin your testing by starting the stream..
Understanding the test output
The live results of this test will be displayed on the main Output screen (see below).
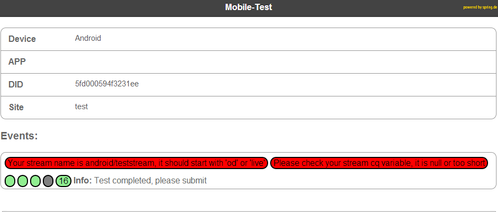
Illustration 2: Example main output screen
In the Events section of this page you will see:
- A counter with the analyzed requests. The screenshot example above contains a “12” in this box, indicating that “12” requests have been generated up to that point.
- Any messages generated by the 'validator'. The validator assesses specific TV Player Report project variables such as the library version being used, content ID, and the stream variable.
The stream requests are split out on screen within the large bars. The screenshot shows these in red and yellow. The status of each section is colour coded to highlight specific warnings when something is incorrect:
- Red: Error
- Yellow: Warning
Once all parts of the request are correct, the app will return no error messages, indicating that your implementation is correct.
Important additional information about the on-screen interface
Below the main bars in the Events section of the page, the tool also contains 4 greyed out round ‘traffic lights’. These indicators are used to highlight the following standard mobile app actions:
- STARTED
- FOREGROUND
- BACKGROUND
- CLOSED
You may see these traffic lights “go green” during your test as each action is positively verified. This is purely documentary and does not indicate whether your TV Player Report project implementation is correct.
‘Warning’ or ‘Error’ messages
Should you encounter ‘Warning’ or ‘Error’ messages then:
- Verify and check your implementation – you can view the log stream requests to help you further understand the error (see below for more information)
or - Contact the Spring technical group at support@spring.de. Please ensure that you copy our main UK TV Player support team at TVPlayerSupport@kantarmedia.com.
Viewing your log stream requests
Press the "View Request" button to view all the information in a JSON object which contains all messages from the Validator.
This output can only be viewed on screen – it cannot be output to a file.
Example of a correct implementation
Below we demonstrate use of the tool by providing a UK example.
Setting up the test tool
We left the first field (app name) blank because it is optional.
In the second field we put the Advertising ID of our Apple device.
In the third field we put the sitename (c4ios).
Last but not least, don’t forget to highlight the proper OS!
(In this case we are testing the 4oD iOS app).
After clicking “Start test!” and a stream has been running
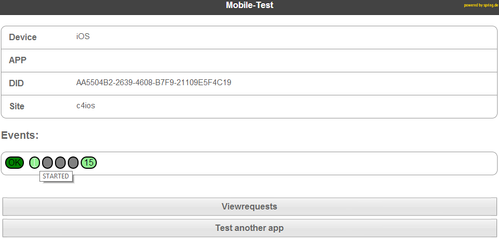
After starting the test tool and then starting the player, you will see the event counter counting through the number of requests as they are processed.
Here we see we have a green round from a successful “app-start” event.
When clicking the “Viewrequests”
Part 1
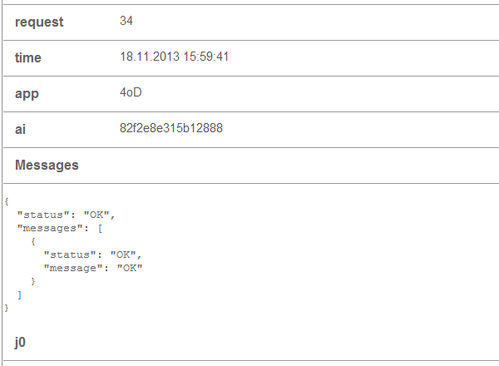
In the above screen shot, we scrolled down through the list of all the heartbeats sent during the test.
In order, you will find:
- The number of the heartbeat sent: 34,
- The time when the server received the heartbeat,
- The app name: 4oD. (This value is obtained from the library app installed in the player and is populated if you have not entered this value in the first screen)
- The Apple Advertising ID after the Kantar Spring library hashed and truncated it and sent it to the measurement systems
- Then follows either a list of the errors and warnings, or as in this case: an “OK” message.
Part 2
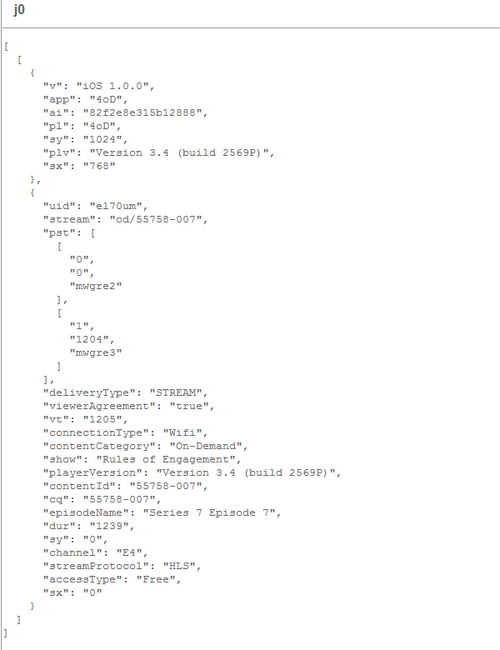
In next part of the test the heartbeat data is broken down and parsed into a readable format.
See Heartbeats sent from the libraries for an explanation of the content.
Metadata:
- “v” = the version of the Kantar Spring library used
- “app” = appname as defined by the broadcaster
- “ai” = the hashed and truncated device identifier. (here: Apple Ad ID after hashing and truncated)
- “pl” = the player name as defined by the broadcaster
- “sy” = horizontal screen resolution
- “plv” = the player version as defined by the broadcaster
- “sx” = vertical screen resolutionU
Usage data:
- “uid” = the viewing session ID; generated at random by the library when it is started
- “stream” = stream identifier as defined by the broadcaster.
- “pst” = the playstates, i.e. the content playhead position(s). The position of the playhead at the time this heartbeat was sent, was at 1204 seconds.
- “vt” = viewtime.
- “cq” = The content ID, used to uniquely identify the content of the stream.
- “sy” = horizontal video resolution (as opposed to the same variable in the metadata)
- “sx” = vertical video resolution (as opposed to the same variable in the metadata)
- The other variables are additional and optional info that the broadcaster defined via the “desc”-variable.
Conclusion
This implementation is correct from a format point of view and the output can be correctly pro-cessed by the Kantar Spring systems.
The app can now be considered “ready” for your project!